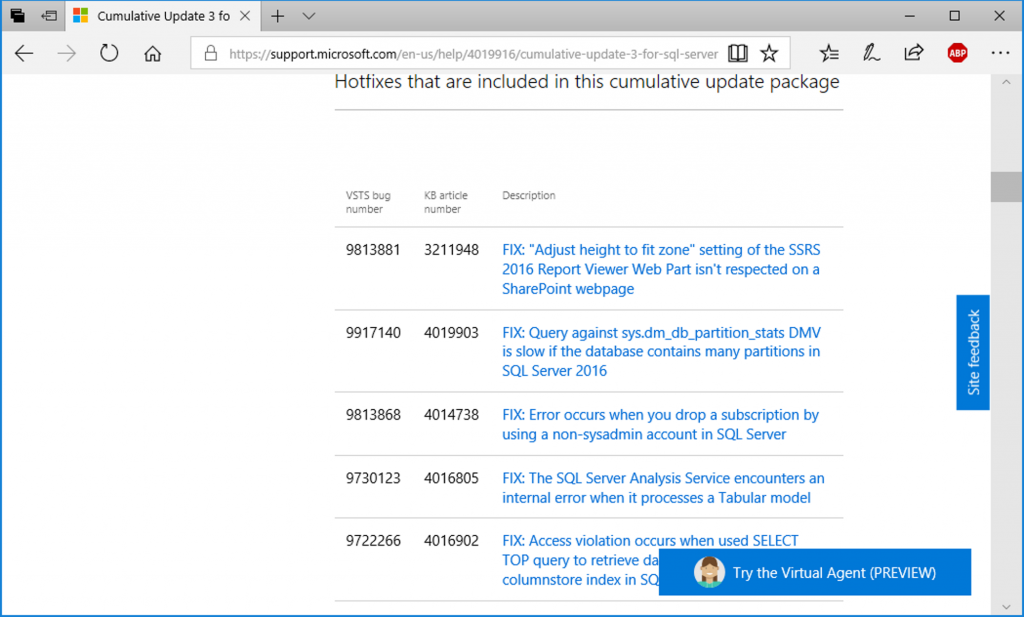
Lately, for whatever reason, we’ve had clients running into a small rash of bugs or bug-like behavior in SQL Server; so me in the Engine, some in SSRS (the SSRS ones have been fun). In one case, it occurred a day or two after SQL Server 2016 SP1 CU3 was released, so we (I was talking to Joey about it at the time) had a list of fixes to go through.
This is fine and all, but when one is looking for a fix for a specific behavior (“I’ve had this bug all summer, so I want to look through every CU release to see if it’s in there”), it’s a bit of a pain to go through the whole list just scanning for the, say, Reporting Services fixes. It’s even worse if the instance is behind and you need to look through multiple CUs for something. Another scenario is if you are just reviewing a newly-released CU and really only care about fixes that pertain to the engine…you get the idea.
Business Intelligence to the Rescue!
Fortunately, there are some tools built right into Excel that make this a whole lot easier than scrolling through the list in your browser. Armed with nothing more than the URL to the CU’s KB article and Excel 2016 (or a few older versions) quick work can be made of generating custom filters for this data.
Here are the steps:
In Excel 2016, click on the Data tab of the ribbon. This is where the artist formerly known as “Power Query” lives, now referred to as “Get & Transform.”
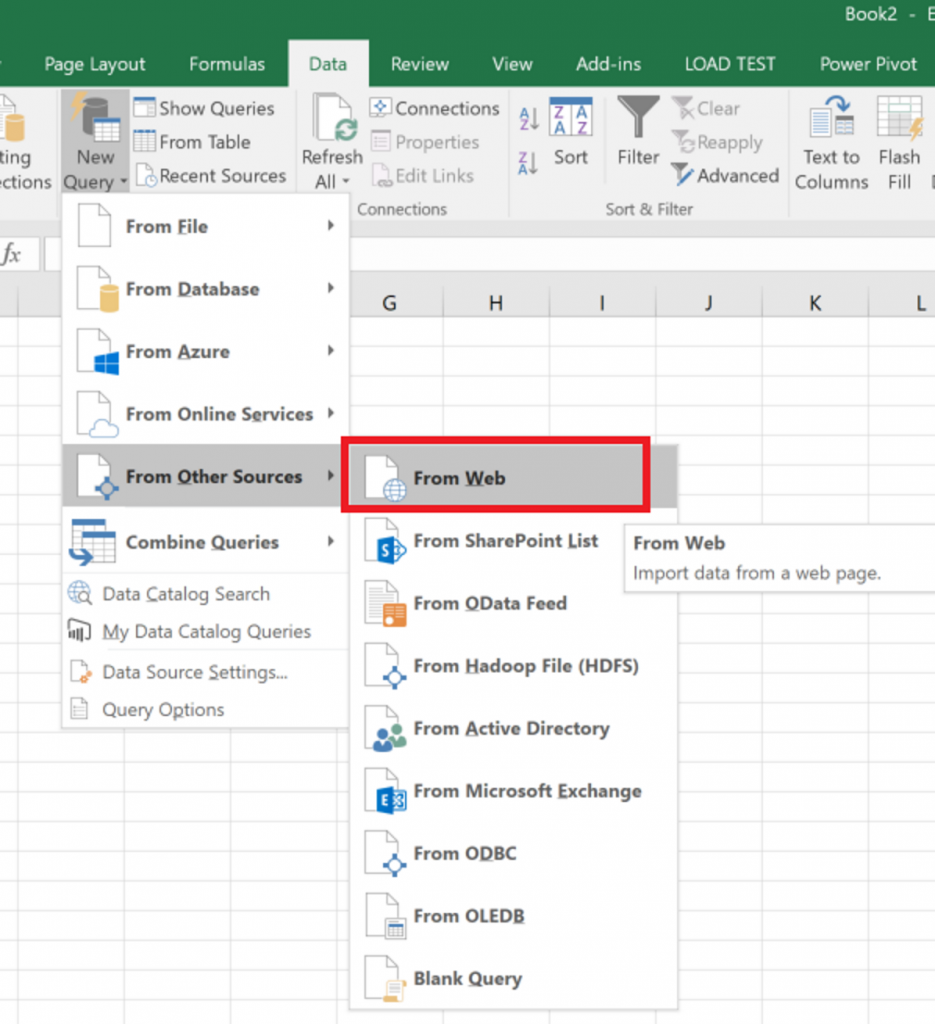
Starting with the New Query button, navigate down through the menu to From Other Sources and then From Web:
This brings up a simple little dialog that asks for a URL. Paste in the URL for the CU page you’re interested in; here, I’m using SQL 2016 SP1 CU3’s URL: https://support.microsoft.com/en-us/help/4019916/cumulative-update-3-for-sql-server-2016-sp1
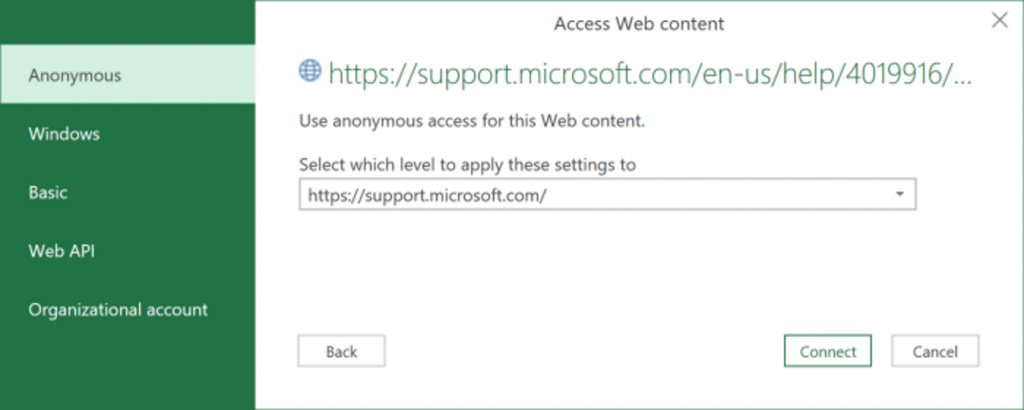
Clicking OK brings up the next dialog, a security-related dialog that allows you to provide any credentials that may be needed to access the material. Of course, in this case, no specific credentials are needed, as it is a public web page. Leaving Anonymous selected here is the way to go.
Clicking Connect will bring up the real meat of Power Query Get Data, where we will choose what data we want to import, and optionally do some ETL-like transformations to it.
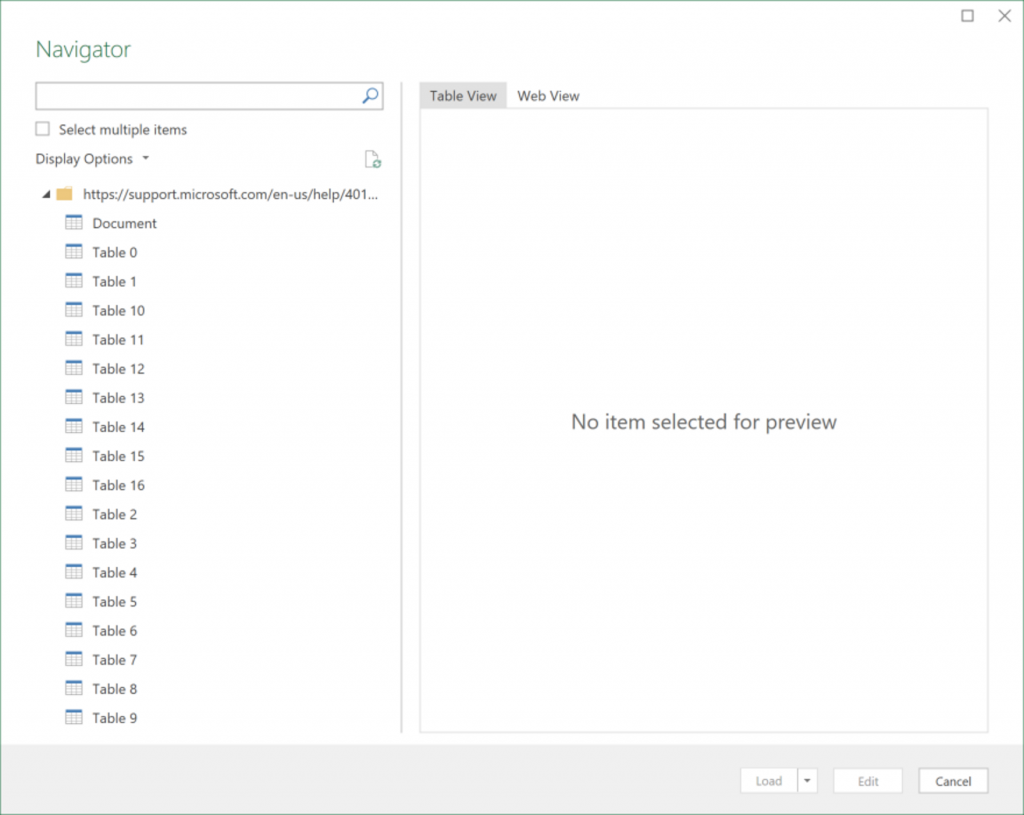
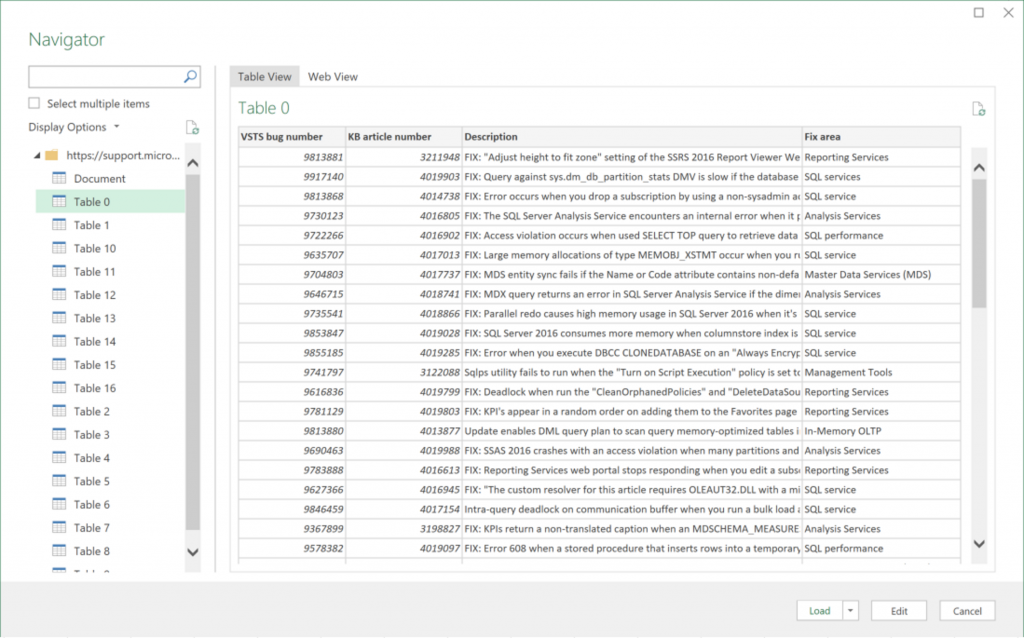
Whenever pulling in data from a web page/table for the first time, there is a bit of experimentation that needs to happen. For example, when the “Navigator” dialog opens for the first time, there’s a big list of Tables from the web page, and no data displayed:
What has to happen, is you need to find which of those tables contains the data on the web page you’re interested in. In our case, we’re interested in Table 0, where we can see the data we’re looking for; mainly the Fix area column:
Quick note: The reason for so many tables of other data on this page is that down towards the bottom of the page, under the “Cumulative update package file information” link/collapsed menu are a bunch of tables that contain a bunch of information about all of the files that are modified by fixes in this CU. All of those tables are available here, too.
Once the table you’re interested in is selected, we can move on. The next step could be clicking the Edit button, where you’d be able to do all kinds of transformations to the data in this table… here, we don’t need to do that, so can skip that part and go straight to loading the data.
As we’re only looking to read through this data on its own (as opposed to loading it into a Power Pivot data model), we can just click the Load button.
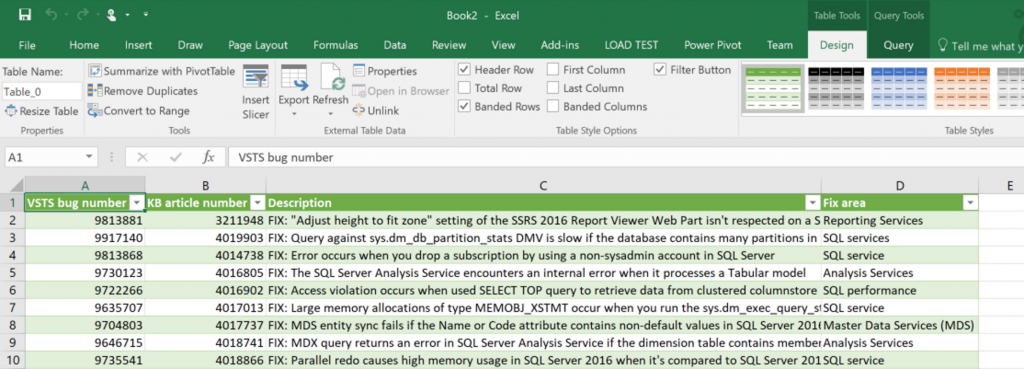
The end result will be a table of data in Excel that contains all the fixes in the CU:
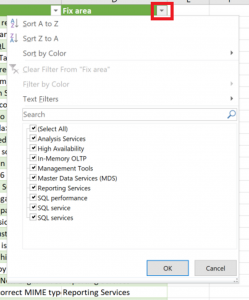
The best part about this, and the whole reason we’re here, is Excel’s “Auto Filter” feature works on this table (and it is already activated, even). Clicking on the arrowhead in the “Fix area” column yields this familiar pop-up menu, where all manner of sorting and filtering can be done.
Simply check the area of the product you’re interested in from the list, and you’ll be presented with a nice short list of fixes to look through.
Awesome!
Re-use
But, let’s say you’ve gone through this, and you’re thinking “that was kind of a pain, and won’t really save any time for all the more often that page needs looked at.” That’s possibly a fair assessment. Since all of these CU pages are identical (for now), the extract logic stays the same, with the only thing needing to change being the source URL. Once you’ve set up this workbook once, you can save the file and modify the URL it pulls its data from when the next CU comes out, but the amount of clicking required to do that is about the same as it takes to set this up the first time, therefore I’m not sure how helpful that would be.
Probably the best thing to do is to save this file off after you’ve created it and reference it as-needed, clicking the Refresh All button on the Data tab when you open this to make sure you have current data.


Wow that is actually really awesome. So lets say I wanted to use this as a prototype for a web app or powershell script, is there a way in PowerQuery that I could see the xPath or css selector to get that table from that web page?
That’s a great question, and I have no idea.
I thought maybe there would be something helpful along those lines in the M query underneath, but no such luck. Something magic is happening under the covers that either we can’t see or I just don’t know enough about.